If you manage a website, you’ve probably seen both exit rate and bounce rate in your analytics reports and maybe wondered what the difference really is. At first glance, they seem similar, but understanding how they work (and how to use them together) can unlock powerful insights about your audience’s behavior.
In this guide, we’ll break down the exit rate vs bounce rate comparison in simple terms, explain how each is calculated, and show you how to use them to improve engagement, navigation, and conversions. You’ll also see how tools like Slimstat Analytics make it easier to analyze both metrics right inside WordPress, without relying on third-party trackers.
What Is Bounce Rate?
Bounce rate measures the percentage of visitors who land on a page and leave your site without doing anything else, no clicking, no scrolling to other pages, no interaction.
If 100 people visit a blog post and 65 leave immediately after reading it, that page’s bounce rate is 65%.
You can check your bounce rate easily in Slimstat’s visitor analytics reports or Google Analytics.
How Bounce Rate Is Calculated
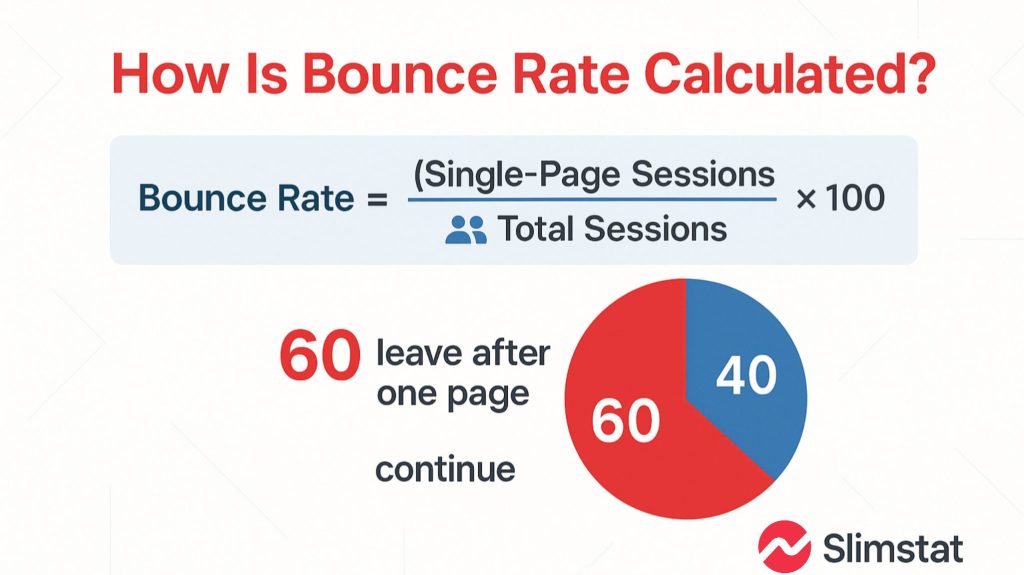
The formula is simple:
Bounce Rate = (Single-Page Sessions ÷ Total Sessions) × 100
If a visitor enters your site through one page and leaves without triggering any other event, it counts as a bounce.
To make bounce rate tracking more accurate, Slimstat allows you to record specific user events (like video plays or downloads). Learn how in our article on Event Tracking vs Pageview Tracking.
For more on analytics math, see HubSpot’s bounce rate breakdown.
Why Bounce Rate Matters
Bounce rate shows how engaging or relevant your landing pages are. A high bounce rate could mean:
- The content didn’t match the visitor’s expectation.
- The page loaded slowly.
- The design was confusing.
But, and this is key, not all bounces are bad. For example, a user might visit your “contact info” page, get what they need, and leave.
If you want to know when a bounce is actually a problem, compare it with exit rate. That’s where the “exit rate vs bounce rate” distinction becomes crucial.
What Is Exit Rate?
xit rate measures the percentage of sessions that end on a particular page — regardless of how many pages the visitor viewed before leaving.
If someone visits your homepage, then your pricing page, and exits there — that’s recorded as an exit, but not a bounce.
You can find these numbers in Slimstat’s WordPress analytics reports or through GA4’s page-level metrics.
How Exit Rate Is Calculated
Exit Rate = (Total Exits ÷ Total Pageviews) × 100
For example, if your pricing page was viewed 1,000 times and 300 visitors left from that page, the exit rate is 30%.
To analyze this visually, you can use Slimstat’s “Traffic Flow” view to see which pages lead users to leave most often.
You can also compare exit patterns with Hotjar’s heatmap insights.
Exit Rate vs Bounce Rate: The Key Difference
Here’s the short version:
- Bounce Rate measures sessions that start and end on the same page.
- Exit Rate measures how often visitors leave a specific page — regardless of their journey before it.
Let’s look at both side by side:
| Metric | Definition | Example | Indicates |
|---|---|---|---|
| Bounce Rate | % of visitors who view only one page and leave | User lands on your homepage and exits immediately | Poor first impression or mismatch with search intent |
| Exit Rate | % of sessions ending on a given page | User reads 3 pages and leaves on the contact page | Where users finish their journey or lose interest |
All bounces are exits, but not all exits are bounces.
Check this visually in Slimstat Analytics and read Semrush’s full explanation for deeper context.
How to Interpret Exit Rate vs Bounce Rate
High Bounce Rate
- Visitors may not be finding relevant content.
- The page could be too slow or overwhelming.
- You might be attracting the wrong traffic from search or ads.
Use Slimstat’s traffic sources report and Ahrefs’ intent analysis to match keywords with user expectations.
High Exit Rate
- Visitors leave deeper pages (like checkout or product listings).
- Indicates where friction or confusion happens.
Monitor it in Slimstat’s behavior reports or with Crazy Egg.
Low Bounce but High Exit Rate
This often means your content engages visitors initially but fails to convert. Consider adding CTAs, related links, or exit-intent popups.
You can see conversion flow in Slimstat’s funnel analysis and compare against Databox benchmarks.
Why Both Metrics Matter Together
Both bounce rate and exit rate tell complementary stories:
- Bounce rate helps you measure first impressions.
- Exit rate helps you measure user satisfaction and journey completion.
Analyzing them side-by-side helps uncover UX, navigation, and content quality issues.
Slimstat’s real-time dashboards let you compare these metrics instantly — perfect for spotting trends early. Learn how to set that up in our post on Real-Time Analytics in WordPress.
How to Reduce Bounce Rate
1. Improve Page Relevance
If visitors bounce right away, the content might not match their intent.
Use keyword data from Slimstat and Google Search Console to align titles and metadata with search behavior.
2. Use Internal Links Wisely
Guide readers toward other articles naturally.
For example, link to What Is Bounce Rate and Why It Matters or Difference Between Sessions, Users & Pageviews from your intro or conclusion.
Check internal linking strategy examples on Moz.
3. Enhance Readability
Break long paragraphs, use visuals, and highlight key stats.
Compare readability performance inside Slimstat and review content format tips from Yoast’s SEO readability guide
How to Reduce Exit Rate
1. Strengthen Calls-to-Action
Ensure every page tells users what to do next, sign up, read more, or start a free trial.
Track CTA performance with Slimstat’s event tracking, and use examples from Unbounce’s CTA playbook.
2. Optimize Page Speed and Layout
If visitors exit too early, performance could be the issue.
Check Slimstat’s performance reports and compare site speed insights with GTmetrix.
3. Use Exit-Intent Popups or Surveys
Instead of losing a user entirely, offer a discount or ask why they’re leaving.
You can measure engagement using Slimstat’s real-time tracking or tools like OptinMonster.
4. Simplify Checkout or Forms
If exit rate is high on conversion pages, reduce form fields, add trust signals, or simplify payment steps.
Monitor these changes through Slimstat’s user activity tracking and compare against Baymard Institute’s checkout UX research.
Tools for Tracking Exit Rate and Bounce Rate
1. Slimstat Analytics (Recommended)
A privacy-first WordPress plugin that provides real-time bounce and exit tracking without sending data to third parties. It’s perfect for businesses that value data ownership — learn why that matters in Data Ownership: Why It Matters for Your Website.
Compare Slimstat’s features with WPBeginner’s analytics review
2. Google Analytics (GA4)
A powerful cloud-based tool that tracks user engagement and session data across multiple touchpoints. Combine it with Slimstat for a hybrid setup.
Read more in How Web Analytics Works (Simple Explanation) nd Google’s engagement metrics doc.
3. Matomo Analytics
An open-source, GDPR-compliant analytics suite that lets you own all your website data.
Use it alongside Slimstat’s privacy-focused reports for full compliance.
Learn more at Matomo.org .
Common Mistakes in Comparing Exit Rate vs Bounce Rate
1. Treating Them as the Same Metric
They measure different stages of user behavior.
Slimstat separates them clearly in its dashboard; you can also read Semrush’s explanation for additional clarity.
2. Ignoring Context
Comparing blog posts to checkout pages doesn’t make sense — context defines what’s “high” or “low.”
Segment by content type using Slimstat, or learn about segmentation from HubSpot’s data analysis guide.
3. Focusing Only on Averages
Averages hide outliers. Analyze trends and user segments instead.
Check segmented reports in Slimstat or compare with Databox’s metric visualization tips.
Final Thoughts: Using Exit Rate and Bounce Rate to Grow Smarter
Both exit rate and bounce rate are critical indicators of how users interact with your website. When analyzed together, they show not just where visitors leave — but why.
Tools like Slimstat Analytics make it easy to interpret these metrics inside WordPress, giving you real-time clarity without privacy compromises
To dig deeper into optimizing your data interpretation, check out 10 Essential Web Analytics Metrics Explained.
When you understand the full story behind exit rate vs bounce rate, you stop guessing — and start improving.
Frequently Asked Questions
What is the main difference between exit rate and bounce rate?
Bounce rate measures single-page sessions, while exit rate shows how often users leave from a specific page.
Is a high bounce rate always bad?
Not always. It depends on page intent, informational pages can naturally have higher bounce rates.
What is a good exit rate for a website?
It varies by page type, but generally 20–40% is healthy for content pages.
How can I reduce bounce rate on my site?
Improve page relevance, internal linking, and loading speed to keep users engaged.
How can I check exit rate and bounce rate in WordPress?
Use tools like Slimstat Analytics to view both metrics directly inside your WordPress dashboard.