How to Enable and View the Heatmap
The Heatmap feature in the WP Slimstat plugin allows you to see which areas of your website pages receive the most clicks from visitors. This can help you understand how users interact with your site and make informed decisions about content and design improvements.
To use the Heatmap feature, you’ll need to upgrade to the premium (Pro) version of the WP Slimstat plugin. Once you’ve purchased and installed the Pro version, follow these simple steps:
1. Enable the Heatmap
- Go to the WordPress admin menu
- Navigate to Slimstat – Settings – Pro Options
- Check the box next to “Enable Heatmap”
- Click “Save Changes”
2. View the Heatmap on Your Website Pages
- Log in to your WordPress site as an administrator
- Visit the page you want to analyze
- Click the “Heatmap on” link in the admin bar at the top of the screen
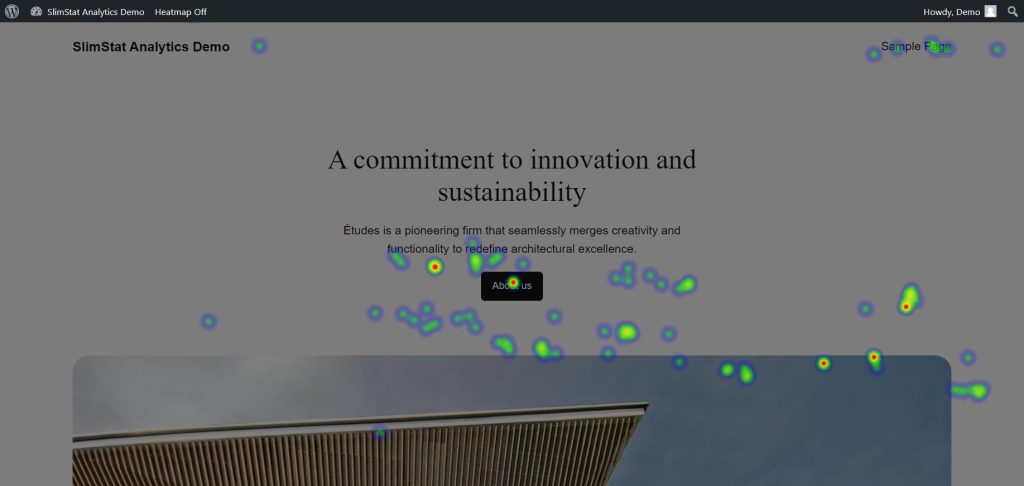
After clicking “Heatmap on,” you’ll see the Heatmap overlay on the page. The darker the color of the dots, the more clicks that area of the page has received from visitors.
You can repeat this process for any page on your website to gain insights into how users interact with different sections and elements.